Lineament Maps – What They Are and How They Are Created
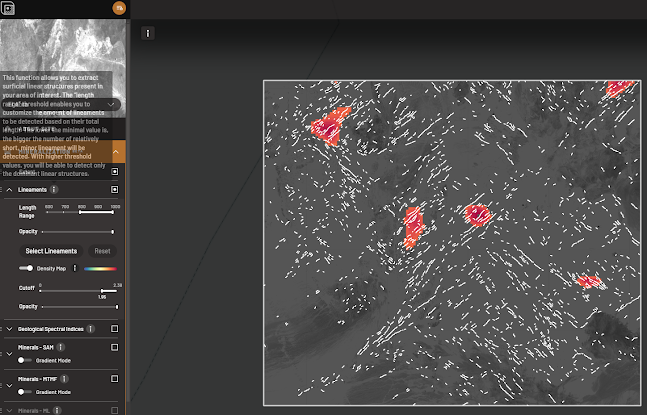
TerraEye introduces a lineament detection algorithm based on Digital Elevation Model (DEM) data. This approach allows for the identification of surface expressions of linear structures, which can be part of local geological formations significant for mineralization. As such, lineament data serves as an important input in the analysis of areas for potential mineral resources.
The detection process is carried out using the Canny edge detection algorithm (Mohammadpour et al., 2020), which has proven to be effective for this purpose. In this version, the results are generated from a DEM derived from the global Copernicus GLO-30 dataset. The Canny algorithm operates in several stages: first, it filters noise to eliminate irrelevant details, then identifies and selects pixels where DEM values change sharply. From these selected pixels, lines are created, and in the final step, thresholding allows for the extraction of strong and clear edges or more subtle ones depending on the settings.
The density map is generated by dividing the lineament map into pixels, where each pixel represents the length of lineaments within it. The number of pixels on the map depends on the chosen resolution; for example, at a resolution setting of 1000, the height and width of the area of interest (AOI) are divided into 1000 sections, creating a 1000x1000 pixel image.
What Are
Lineament Maps Used For?
Lineament
maps are a tool for understanding the geological structure of an area.
Lineaments—natural linear features such as faults, folds, or boundaries between
rock formations—play a key role in geological processes, such as the migration
of hydrothermal fluids, which can lead to the formation of mineral deposits. By
identifying these structures, geologists can gain deeper insights into the
arrangement and genesis of rock formations in a given area, which is
particularly valuable for mineral exploration.
Lineaments
may indicate the presence of subsurface geological structures, such as faults,
that could be associated with mineralization processes. Combined with other
geological data, such as mineralization maps and spectral indices, lineament
maps provide additional information about potential areas of mineral
concentration.
How to
Use Lineament Maps in Early-Stage Exploration?
At the
early stages of exploration, lineament maps help geologists identify areas of
geological interest, especially those that may be associated with
mineralization processes. Linear structures such as faults or stress zones can
act as channels for hydrothermal fluids, leading to the concentration of
minerals. With lineament maps, it is possible to quickly pinpoint areas that
require more detailed investigation, optimizing field research plans and saving
resources.
Lineament
maps can also be effectively combined with mineralization maps and spectral
indices. Mineralization maps provide information on surface mineral
accumulations, while spectral indices (such as those derived from Sentinel-2 or
EMIT) allow for the analysis of areas based on specific geological
characteristics. When lineament results are compared with data from these maps,
geologists can better understand the relationships between geological
structures and the presence of minerals, increasing confidence in selecting
areas for further exploration.
Additionally,
lineaments can be integrated with the AI Clusters functionality. The
clustering algorithm identifies areas with similar spectral and geological
characteristics. By comparing geological clusters with lineament maps, it is
possible to confirm the presence of geological structures responsible for
mineralization processes. This approach allows for a more accurate
identification of high-potential areas and more precise targeting for
geochemical sampling and further exploration planning.
Explore now!


